
Interactive Infographic
Visit this link for an interactive version of this graph.
Background
Diving Into the Data
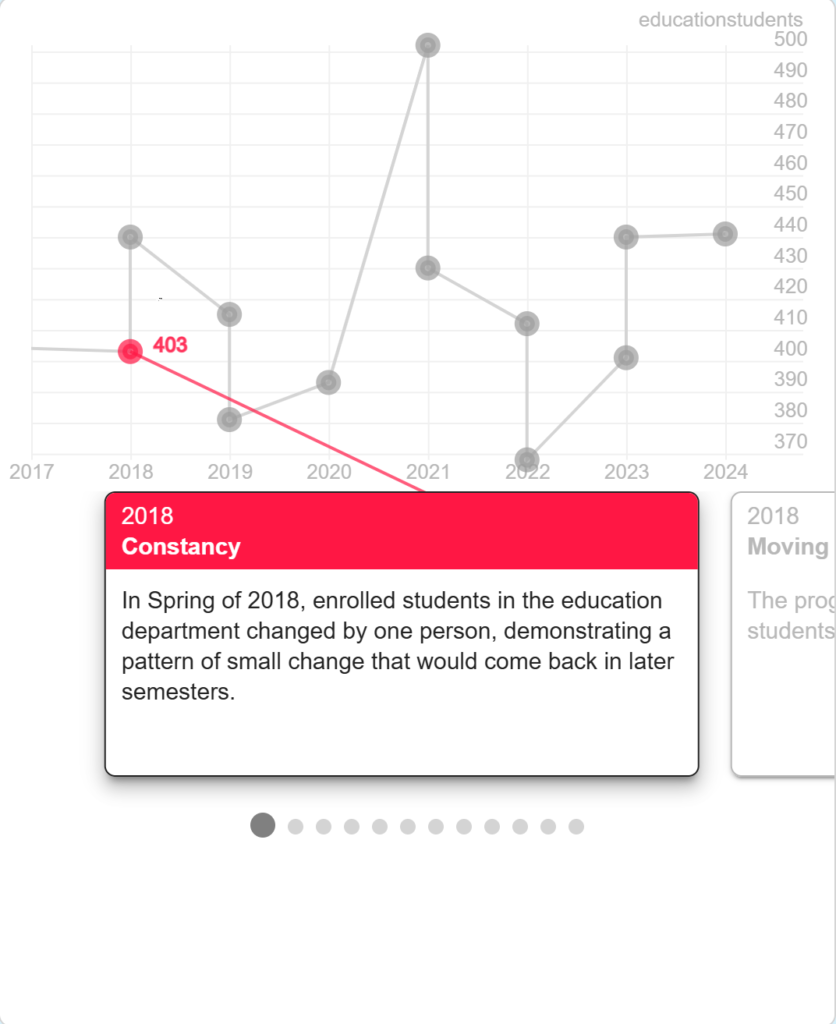
In this project, I sought to investigate the enrollment of students in the UMW education department and examine if/how the number of students changed as the teachers shortage evolved in the US. By examining this data, taken from the annual Grade Distribution Report from UMW’s Institutional Analysis and Effectiveness department, I found a story surrounding curriculum education at UMW that was much different than I expected. Although the number of students enrolled in education classes was not the highest out of the departments at UMW, it was not the lowest either. In fact, the department did not only decrease in the number of students enrolled in education classes, as I had deduced due to the national teachers shortage, but had rather increased or remained stable as a whole. While COVID caused the loss of data for the Spring 2020 and smaller numbers in the Fall 2020 semester, the department was able to recover from COVID, initially growing in the number of students enrolled and eventually leveling off to stable enrollment numbers higher than the Fall 2017 students the data set began with. For more information, check out this Excel Sheet with the data on the number of education students each semester.
What Does This Mean?
While the nation faces a national teachers shortage, the number of students interested in entering the education field, while decreasing initially, has grown to stable, relatively high numbers of enrolled students. This proves that an interest in working in education field remains. Examining data sets and stories such as this one is so important because it allows federal, state, and local education officials to source the problems of the teachers shortage. This data set proves that there is not a decreasing interest in the education field, but rather other factors, such as poor working conditions and pay, that may be causing the teachers shortage. As the child of teachers, the importance of examining the causes and effects of the teachers shortage is important for keeping schools a safe space for learning for all children, with all the necessary resources for learning.
Software and Processes
To make this infographic, I used Excel to decipher the data and create a clean and effective table. This data was then imputed into a Google Sheets form that was used to create an infographic through Storyline’s system.
Credits and AI
AI was not used at all in the creation of this project. All media was created through the Excel or Storyline programs.